Is voter ID a good idea? Voting is one of our most fundamental responsibilities and civic duties. American democracy would not exist without free and open elections. Yet the issue of voting and voter rights (such as voter ID laws) has been a point of contention throughout our history.
Eligibility to vote by citizens of the U.S. is established in the U.S. Constitution and several amendments have broadened prior eligibility requirements “the right to vote shall not be denied or abridged by the United States or any other state on account of race, color or previous condition of servitude”, to include the right of women to vote and anyone age 18 and over.

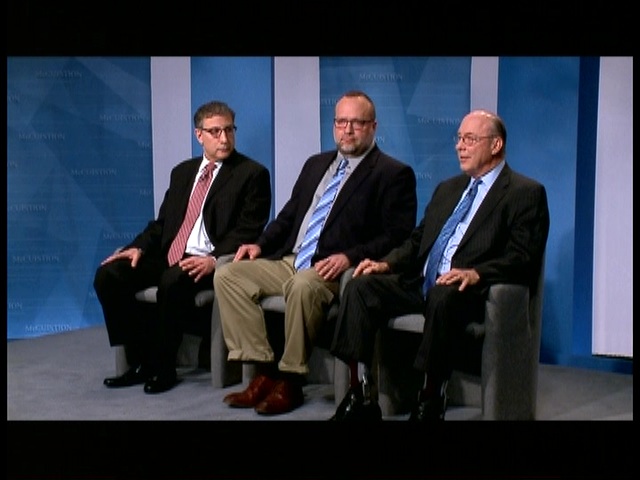
Left to Right: Elizabeth Alvarez-Bingham, Linda Wassenich, Matt Angle & Tom Pauken standing
In 1965, the Voting Rights Act granted the Federal government exceptional power over states to stop “systematic and ingenious discrimination”, which was subsequently amended by the Supreme Court just 2 plus years ago. This has triggered heated debates with, among other issues, voter ID laws and requirements. Supporters of
voter ID laws say they help prevent voter fraud – attempts by ineligible voters to vote. Opponents argue that voter ID laws violate voting rights laws and are actually intended to reduce voting among minorities.
Joining Host, Dennis McCuistion, are participants on both sides of the voter ID debate and what is becoming an increasingly divisive issue:
- Matt Angle: Founder and Director of the Lone Star Project; Former Executive Director of the House Democratic Caucus,
- Elizabeth Alvarez-Bingham: Attorney, Vice Chairman, Dallas County Republican Party
- Tom Pauken: Former Chairman, Texas Workforce Commission
- Linda Wassenich: National League of Women Voters Board Member and Development Chair.
From 84 to 95 percent of all registered U.S. voters already have a state-issued form of voter ID, according to a 206-page analysis of 10 independent studies reviewed by the Government Accountability Office (GAO). According to the GAO, a total of 33 states had enacted requirements for voters to show some form of ID at the polls on Election Day as of June 2014. In Texas, approximately 600,000 Texas residents do not have a government issued photo ID. Texas requirements for voter IDs include any of the following: Driver’s license, concealed handgun license, passport, election certification certificate, a personal or military identification card, citizen’s certificate or naturalization certificate with photo.
The arguments ask Do Voter ID Laws Reduce Voter Turnout?
Ten separate studies reviewed by the GAO showed that the various forms of state voter ID laws had resulted in mixed effects on turnout. All 10 studies examined general elections before 2008, and 1 of the 10 studies also included the 2004 through 2012 general elections. Five of the 10 studies found that voter ID laws “had no statistically significant effect” on voter turnout. Four studies found that ID laws had reduced turnout, and one found turnout had increased after enactment of a voter ID law.
Ownership of valid state ID varied by racial and ethnic groups. For example, noted the GAO, one study estimated that 85% of White registered voters and 81% of African-American registered voters in one state had a valid ID for voting purposes in that state.
However, a nationwide study performed in the fall of 2013 found a much wider range, with 93% of White and 90% of Hispanic registered voters having a valid photo-ID driver’s license, compared to only 79% of registered African-American voters.
If video doesn’t play correctly, open it here.
A separate report issued in 2011 by the Brennan Center for Justice suggested that combined voting laws – including voter ID laws – could cause more than 5 million eligible voters to find it significantly harder or even impossible to cast ballots in future elections.
Census Bureau research has documented how the voting population has grown more diverse in recent presidential elections. Voting rates for presidential elections have shifted from year to year, and have actually decreased across the duration of the time series (64.0 percent in 1980 and 61.8 percent in 2012), while voting rates for congressional elections have decreased as well (48.9 percent in 1978, 41.9 percent in 2014).
In 2014, 43.0 percent of women reported voting, compared with 40.8 percent of men. Reported voting rates were also higher for Whites (45.8 percent) than for Blacks (40.6 percent), Asians (26.9 percent), and Hispanics (27.0 percent). Voters between the ages of 45 and 64 years, with incomes over $100,000 and with advanced degrees, consistently made up a higher percentage of voters than other age groups (Source: United States Census Bureau).
Join us to watch this spirited discussion and chime in with “your vote”.
And have a wonderful holiday season.
Niki N. McCuistion
Executive Producer/Producer
Business Consultant / Executive Coach, specializing in Organizational Culture Change, Governance and Strategic Planning
(214) 394-6794
www.nikimccuistion.com
nikin@nikimccuistion.com


